
RelateIQ, a tool that helps growing businesses manage their sales, announced a major update today that brings advanced reporting to the tool. This is a feature that has been long overdue.
The company, which was sold to Salesforce.com last July for $390M provides CRM services for small companies. Its differentiator to this point has been to help small businesses manage their CRM automatically by having employees link their calendars and email to the product. It then pulls any sales-related activities from the calendar and email to provide a record of activity without any input from the sales person, traditionally a weak link in many CRM tools partly because they often don’t do it, and partly because they aren’t always accurate when they do.
RelateIQ works with Google Apps and Microsoft Exchange.
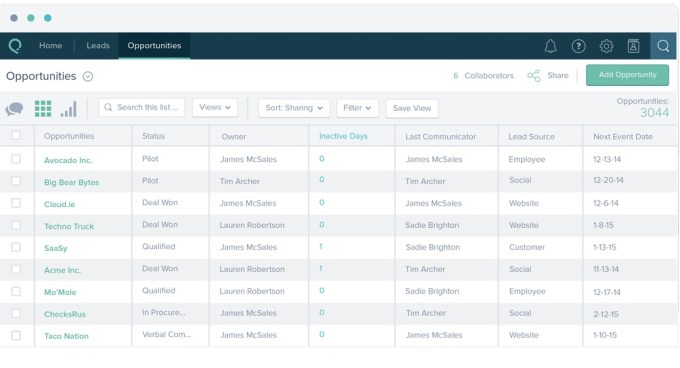
The main interface looks like a spreadsheet and while managers and employees could see the overall big picture this way, and change views, they couldn’t really dig deep into the data that was there all along. Tim Fletcher, VP of product at RelateIQ says the company heard from customers they wanted to be able to make better use of this data, and with this release, they are providing a much richer sets of charts.
“We had some reporting before, but we were getting customer feedback it could be better. We had all this data and [customers] couldn’t surface it in a way people could act on it,” Fletcher said.
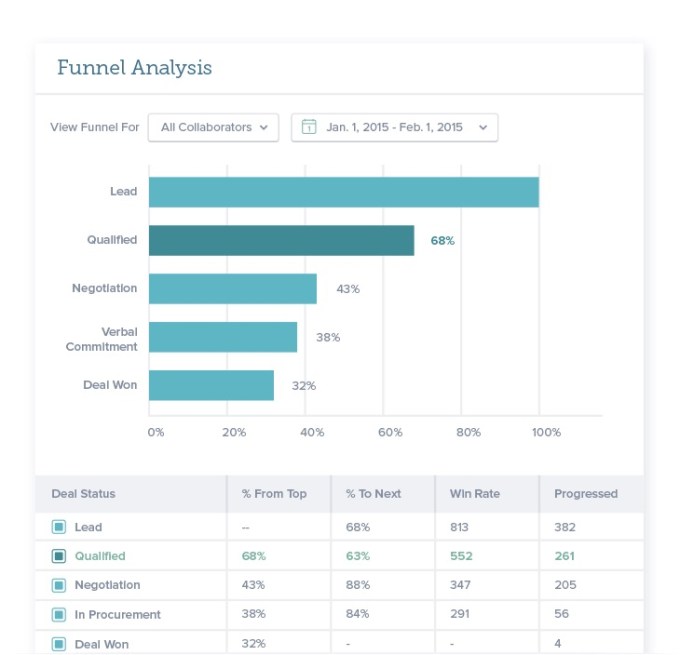
To fix this, they released a new reporting module in the latest version with a set of canned reports the company believes gives customers a useful set of data to view. They divided these reports into three types: activity, pipeline and sales designed to give salespeople and management a deep view into data about how they’re doing and where they could improve. The new module displays these new reports in the form of charts and graphs, making it much easier to analyze than the raw data on its own.
They can look at things like the company leaderboard to see who has the most leads, pipeline value to see income potential or funnel analysis to see how many deals are in each stage of the sales funnel from initial contact to sales won. This kind of detailed data lets everyone see exactly how they’re doing –and managers can see everyone’s data.
Much like its parent company’s typical release schedule, RelateIQ is releasing this incrementally. For this one, they are starting basic, releasing a version tuned for a desktop or laptop computer, but Fletcher says over time they may release a mobile-friendly version. Similarly, they don’t provide any outlet for creating customized reports, but Fletcher did not rule this out for a future version of the product, which he says they are always updating.
Interestingly, even though RelateIQ is part of Salesforce, it is still being run for now as a separate company. Therefore, there is no link to Salesforce1 or Salesforce Wave analytics. Fletcher says there is a lot of potential to collaborate with Salesforce in the future, but they are operating independently for now.
“Our mandate is to focus on growing the business as a stand-alone product. Most customers have less than 100 employees with teams that are growing at a rapid pace,” he explained.